Government corruption. Tautology.
“The extent of corruption in Europe is ‘breathtaking’ and it costs the EU economy at least 120bn Euros, annually the European commission says.”
There you have it. This statement comes directly from the European commission in a recently published report, almost certainly an incompetent bureaucratic nightmare itself , I’ll give credit to them for even publishing this…but it doesn’t go nearly far enough.
The real cost of corruption runs to multiples of what the European commission suggests. Why?
Because what is not included in this report is the corruption that exists with the revolving door between Government and bankers who have sucked trillions of dollars out of the world economy, and who continue to drive respective countries bankrupt, rape and pillage the man on the street and tell him it’s for his own good.
The corruption not mentioned in this report is that of the big banks gaming the stock market. They do this via their proprietary trading desks front running their clients. They do it by packaging up garbage mortgages and bribing the rating agencies to look the other way, rubber stamp said garbage and then flog it to the masses.
Then there is the blatant manipulation of interest rates, juicing the stock and bond markets. Yes this is a corrupt world. Thinking otherwise is like arguing that gravity doesn’t exist. The question isn’t whether manipulation is taking place, or whether the stinking pile of sinister, corrupt lunatics that are our “masters” should be fed to the nearest flesh-eating creature available. We, humble yet unapologetic market participants, can still choose how we interact in the market place.
On that note, today I present to you some interesting facts which I’ve nicked from a recent Trade Alert we sent to our subscribers. If you have yet to opt-in to this currently complimentary service, you can do so HERE, and get a copy of that alert immediately. We think it’s well worth the price… Oh, wait, it’s FREE.
Meanwhile, here’s the thesis we used to create it…
The first is a graph showing the expiring month of gold traded vs the next deliverable month for nearly 4 years.
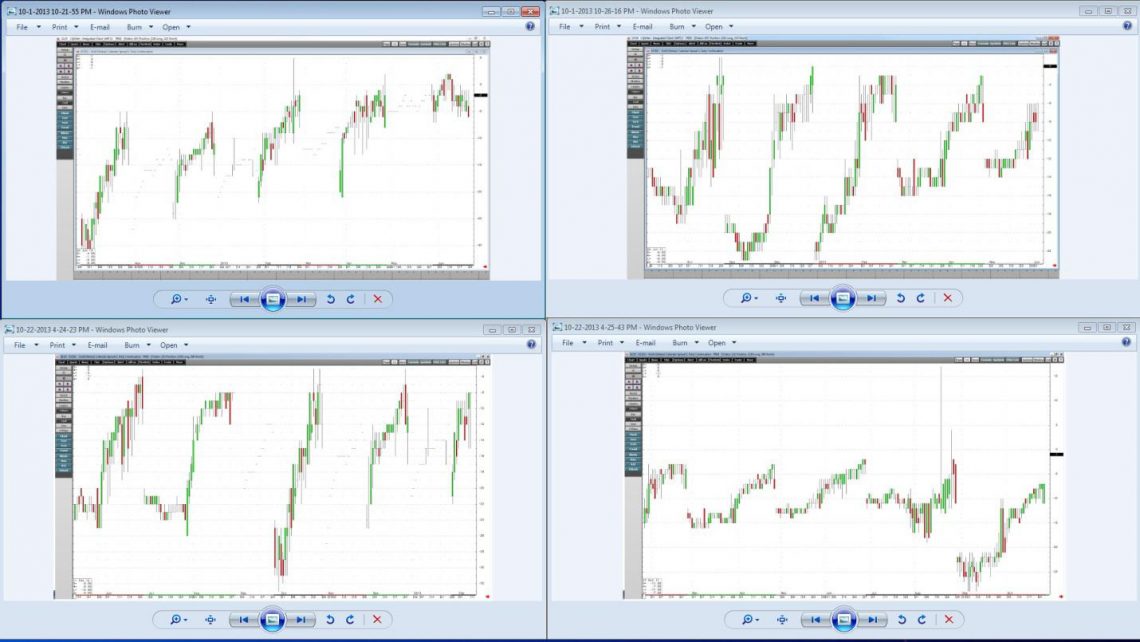
The traders amongst you will find the pattern here interesting. This is called an “inverted” situation, where gold for delivery in the front months trades at a premium to the back months. It is an unusual situation since there are costs associated with holding inventory. Unless the market participants believe there is an impending supply coming into the market you don’t usually see this setup.
The answer may well lie in something which Kyle Bass touched on in this interview at the AmeriCatalyst conference. He explains succinctly why he advised the University of Texas to take delivery of $1B in gold from the COMEX.
Here’s a snippet of his conversation with the head of deliverables at the COMEX:
Kyle Bass: What if 4% of the people want delivery?
Comex: Oh Kyle that never happens, we rarely get a 1% delivery.
Kyle Bass: Well what if it does happen?
Comex: Price will solve everything
Kyle Bass: OK, give me the gold
Now I’d like to show you another chart which is excerpted from the full Trade Alert
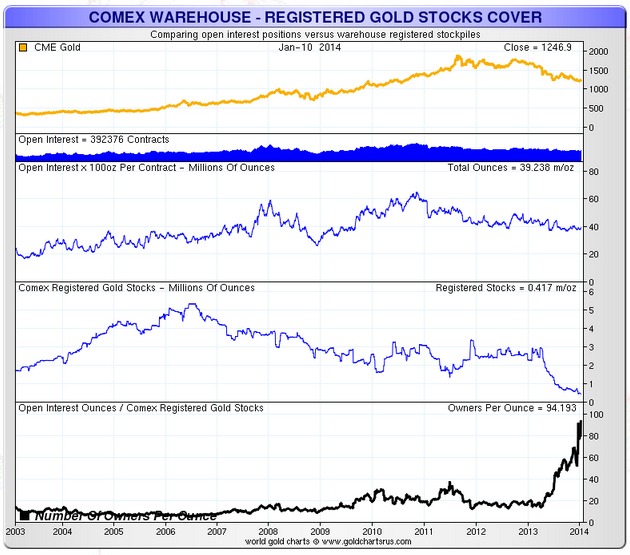
This is a graphical representation of the amount of gold in Registered Comex inventory. What is evident from this chart is that the amount of physical gold inventory at the Comex is going down. According to the latest numbers registered inventories are now at just 402,000 ounces.
At $1,200 per ounce this represents $504 Million in available gold for delivery.
We feel there is a trading opportunity where shorts make sure they’ve gotten out before settlement arrives. This has been happening for 4 years at least. All well and good. Traders take notice.
For long term investors the evidence is clear. TAKE DELIVERY, you’ll be no worse of for doing so. If this eventuates in a short squeeze paper holders will be left holding…well, paper. Running the math here, if just one small player in the gold trading game got nervous and like Kyle Bass, demanded delivery of a position limit size (equal to 3,000 contracts or 300,000 ounces), the Comex would empty fully 71.9% of its deliverable supply. But don’t worry, price will solve everything! Really?
The actual trade which our own Brad Thomas presented in the Alert is a gold miner. The company he is targeting has enjoyed a spectacular 76% collapse from its highs. The entire trade is too long to post here, so again, if you aren’t already getting our Trade Alerts go and sign up HERE and get all the sordid details.
Meanwhile, I’m reminded of some other soothing facts our friend Mark Schumacher from ThinkGrowth.com recently shared with us, and deserve repeating, when contemplating buying a stock that has done nothing but go down:
Average 3-year nominal returns when buying a down sector (since 1920s):
Down Avg. Annual Return
60% = 57%
70% = 87%
80% = 172%
90% = 240%
Average 3-year nominal returns when buying a down industry (since 1920s):
Down Avg. Annual Return
60% = 71%
70% = 96%
80% = 136%
90% = 115%
Average 3-year nominal returns when buying a down country (since the 1970s):
Down Avg. Annual Return
60% = 107%
70% = 116%
80% = 118%
90% = 156%
I’ll leave you with those figures and facts. Choose to do with it what you will. If you wish to get Brad’s alerts complimentary for a limited time you can still do so HERE.
– Chris
“Develop your own opinion. Go look at these numbers. Don’t listen to me… The key is to do your own work.” – Kyle Bass