Things are, as you can imagine – extremely busy at HQ here.
We are working our tails off right now for our clients because the environment we’re in absolutely requires 110% of our attention and it’s getting it.
On that note one of the sectors we cover very closely is the bitcoin market.
And today it is my pleasure to introduce you to partners of ours who behind the scenes provide us with deep analysis of this particular market.
I met Jon de Wet many years ago now but really got to know him well about 3 years ago when I was digging into and diligencing an FX trading firm that clients had brought to my attention.
They were encouraged to invest in their strategy and I was asked to opine.
Long story short with Jon’s help we identified that this particular firm (I won’t name names here) was full of isht and the probability they were fraudulent was extremely high.
We passed this information on to our clients and it was about 6 months ago that they were shut down by the SEC for… being full of isht.
Suffice to say Jon is ridiculously thorough… to the point where I’m quite sure that living with him must be… ahem… a challenge (sorry mate it has to be true).
That quality is exactly why we work with the firm in which he’s a partner.
Today I’ve got an update from Jon and his firm Zerocap, who I’ve personally used to execute OTC trades in Bitcoin.
Their experience lies not only in crypto, but in proprietary FX trading, liquidity and banking. They’re super efficient where you’re needing to do trades of more than a few thousand dollars and want the best possible price, privacy and speedy execution.
So if you’re interested in the service… well you now know who to call.
Email them here and tell them Chris sent you.
Now that I’ve set the scene, over to JD.
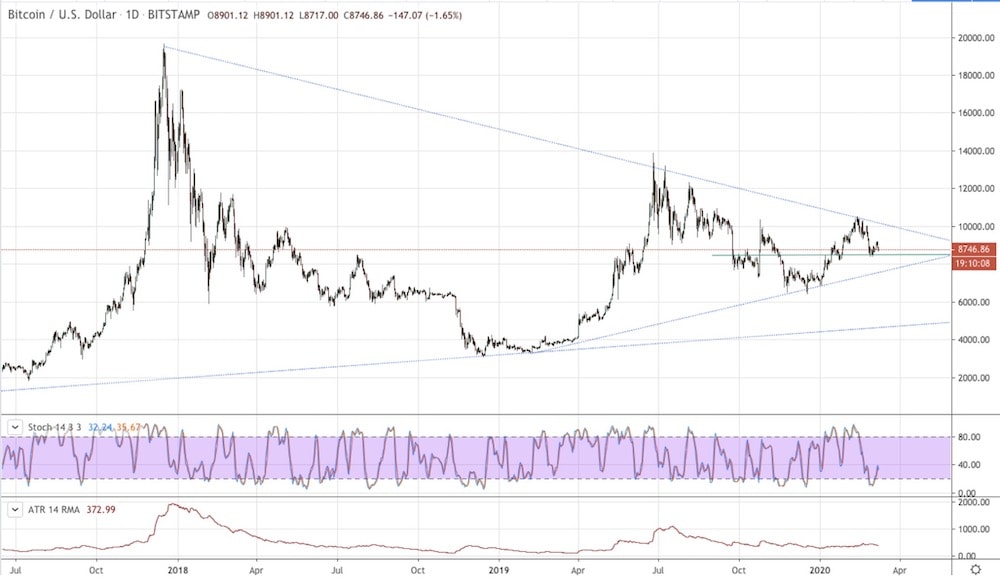
It’s the time of month that our partner Ryan cannot stand: where I draw all kinds of weird lines on the chart and make ridiculous forecasts.
BTC 2017 to Present: Daily Chart
BTC March 2019 to Present: Daily Chart
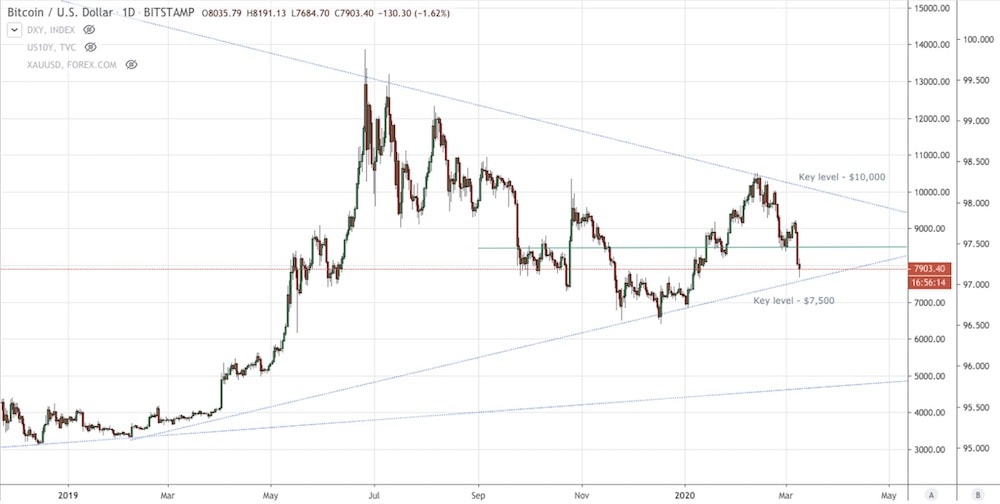
Been an interesting few months for BTC. January saw the $7,000 base hold (albeit with a little false break), leading to a rally that coincided with risk assets (gold and treasuries in particular) – topping out at $10,500 in early February. This is where things got interesting. We’ve always maintained that bitcoin is a store of value and wealth. It’ll hold an eventual limited supply of 21 million coins – is impervious to central bank liquidity programs and bad Cypriot haircuts.

In short, you become your own bank in an asset that is out of the hands of pesky governments and central bankers. Now I know what’s coming: “What about the volatility?” “Why doesn’t BTC always follow gold and other safe-havens?” “It’s used to buy drugs!”
Let’s take a look at what happened as the recent correlation began to break down. Below maps BTC/USD against gold (XAU/USD) over the past year:
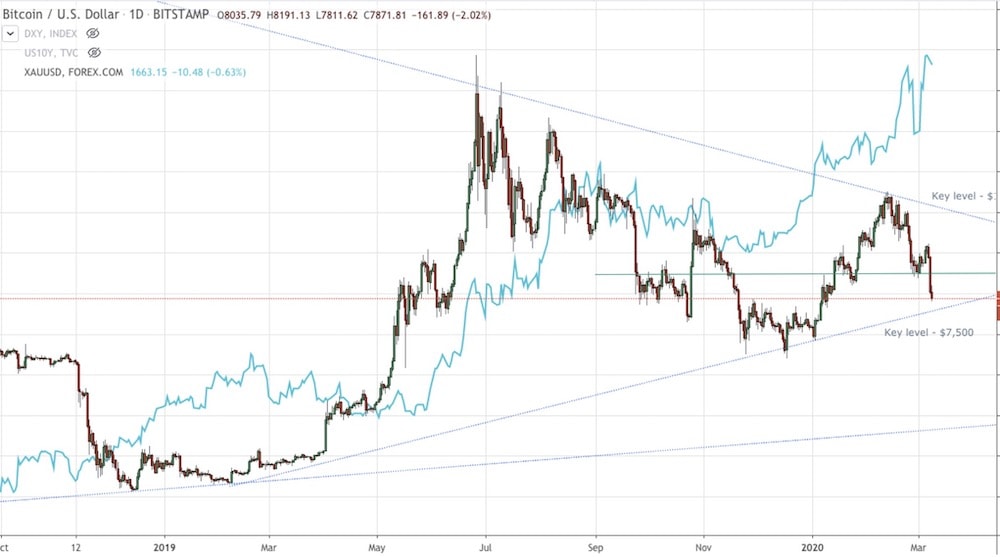
You can see that the correlation held reasonably well from May 2019 until into February 2020, when Coronavirus began to look a little out of control. Let’s map BTC against another risk measure, treasury yields (inverted):
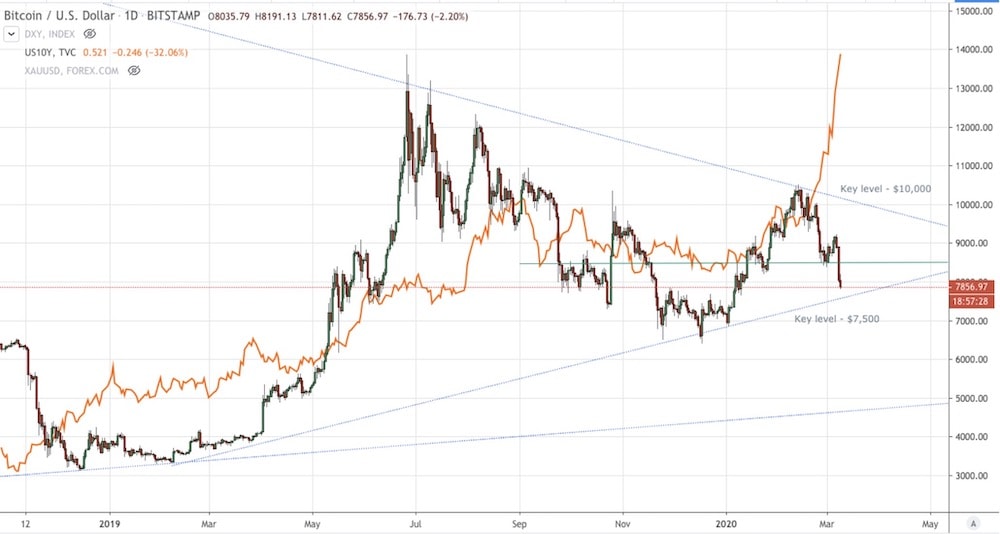
Again, looking good until the recent decoupling in February, accelerating as the crisis worsened.
If BTC is not tracking against gold and treasuries during this early stages of this crisis, then I wonder if it’s correlating with anything… Let’s check the good old US of A’s very own, USD:
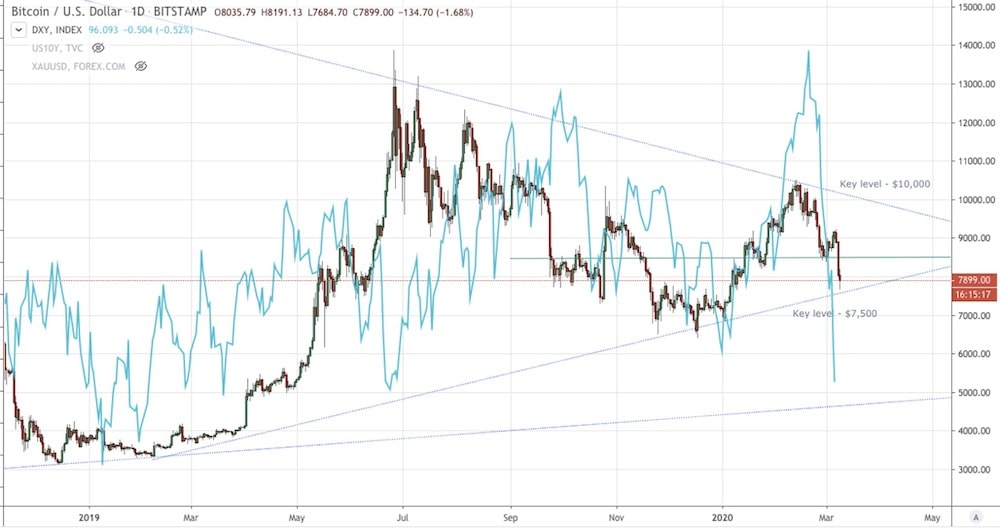
This correlation is pretty ripe at times, particularly recently (as perceived systemic intermarket risk has increased). Notably, the USD has a few different levers, and is often pulled in many directions. Key USD drivers are generally inflation, growth or risk. Market risk trumps them all in terms of impact.
Right now (March 9, 2020) the USD is being sold off due to a recent emergency interest rate cut and downward expected future growth concerns, although this sell-off won’t last if the virus driven risk environment continues to worsen. In a full on crisis scenario, capital will flow into assets that hold the greatest liquidity – the USD being the primary recipient.
Where am I going with all this? We believe that BTC is slowly beginning to play the role of a liquidity/value haven, but only when the market exceeds a level of risk.
John Kickligher, Chief Currency Strategist DailyFX, puts the phases of risk well into the following chart:
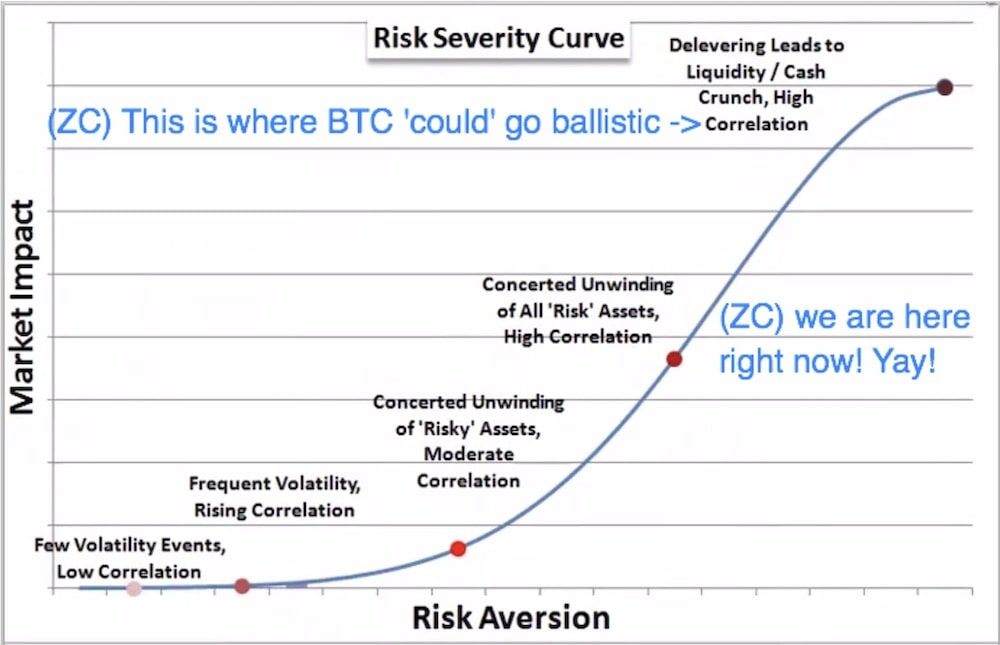
Now I know, I know… Bitcoin’s market cap pales in comparison to the likes of the USD and gold, but we’ve undoubtedly been seeing increasing institutional sponsorship and application in the space (for real this time). I was on the phone to Digital Gamma recently who have created the first Tri-Party Repo for the digital asset space; this is fully operational (we are about to test it).
Additionally, we’ve been seeing increasing futures market volumes, a plethora of institutional lending products, and the custody and counter-party challenges being solved for security conscious family offices and instos. In summary: increased institutional speculation and hedging will naturally lead to these kinds of correlations becoming embedded into intermarket flows.
These correlations don’t always play out perfectly though, in any market — particularly in FX. For instance, the carry trade has seen the EUR acting as a funding currency, due to negative ECB rates:
“No one wants to hold euro cash as an asset any more, but everyone wants it as a liability,” wrote Mr Saravelos. “As a result, the eurozone is emerging as the new global provider of liquidity to the international financial system.”
Financial Times, Feb, 2020
The carry unwind has been playing out since February, and increased in velocity today when the proverbial shit hit the fan — we saw EURUSD rally into risk. Players departing their borrowed EUR / long risky asset positions.
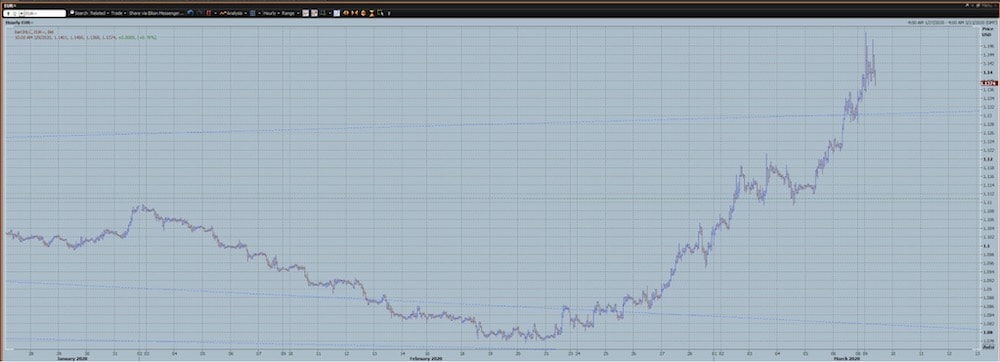
Check out the EURUSD against the VIX; a picture says a thousand words:
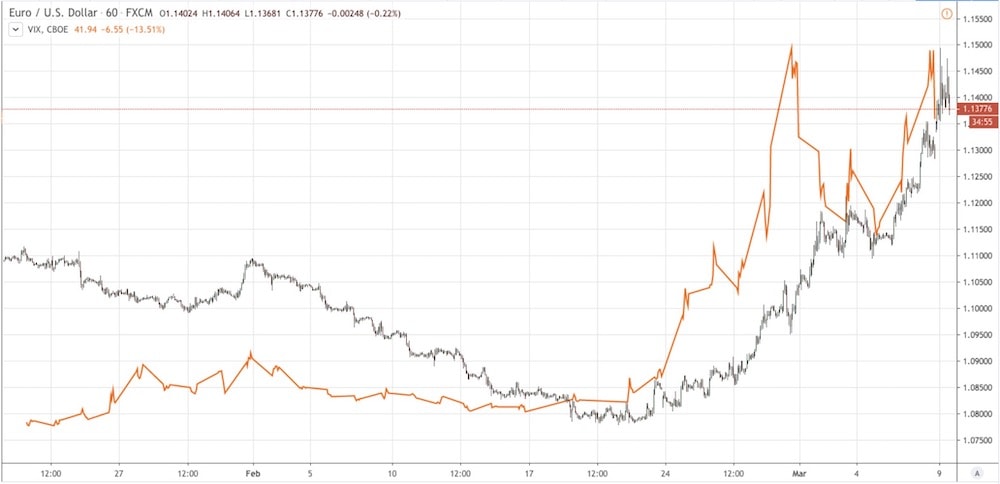
The FX examples are really just to illustrate that correlations come and go, and that BTC will be no different. We do, however, take keen note of its recent moves alongside the USD. We are bullish on USD if this crisis deepens, and in that scenario, we are very bullish on bitcoin for three key reasons:
1. The crisis
It’s already leading to emergency interest rate cuts and talk of negative rates in countries that have never had negative rates.
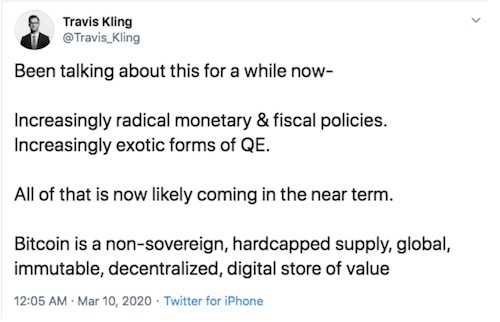
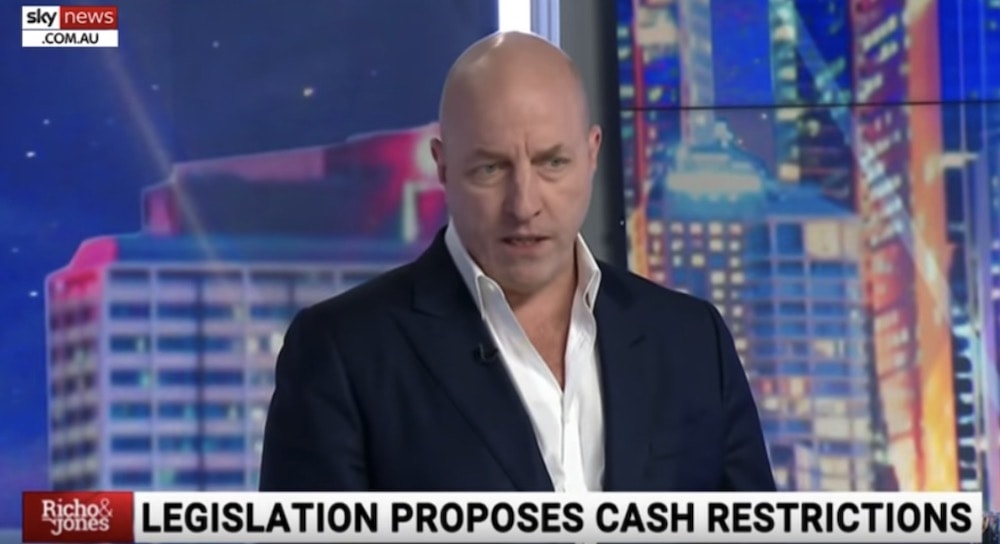
There are associated programs that will be popping up as a result of negative rates. They’ve very quietly passed a bill here in Australia that will limit cash transactions above $10,000 AUD.

On paper this sounds reasonable, right? Kill the black economy, spur growth for all the honest citizens! Reading between the fine lines, governments are looking to find ways to force spending, and this is the first step to more drastic measures. The IMF published a report “Monetary Policy with Negative Interest Rates” in 2018. Topics covered: expiry rates on banknotes, a serial number lottery plan — where the central bank chooses at random every year banknotes that instantly become unusable. That $50 you won at poker the other night… Worthless!
The $10K cash ban is heading in this direction,forcing oversight and mandating spending. For a take on this have a listen to Matt Barrie from Freelancer.com:
Where will people put their money? Bitcoin is looking pretty good.
2. The Halving
Yes, that magical time every four years, where we get a leap year and a halving of the mining reward for bitcoin. You see, the idea of ‘mining’ to validate transactions on the blockchain, and earn a little BTC, was imperative to solve the double spend issue; making sure that the ledger of transactions was not to be f*!ed with. This creates one of the most secure systems of value transfer in the world. However, if we consistently provided miners with the same reward for solving or validating each block, the 21 million BTC supply may be hit prematurely, and create unstable inflationary price pressures. The idea is to gradually reduce the supply curve, not increase it (central bankers take note). The halving mechanism ensures that deflation of the supply is relatively stable,with new coins beginning to appear two times slower, every four years, until the final 21 million bitcoin supply is met.
This clever supply-decreasing algorithm was chosen because it approximates the rate at which commodities like gold are mined. Interestingly, the last bitcoin will be mined after the 64th halving event, which should take place around 2140, whereby block rewards will be replaced by transaction fees.
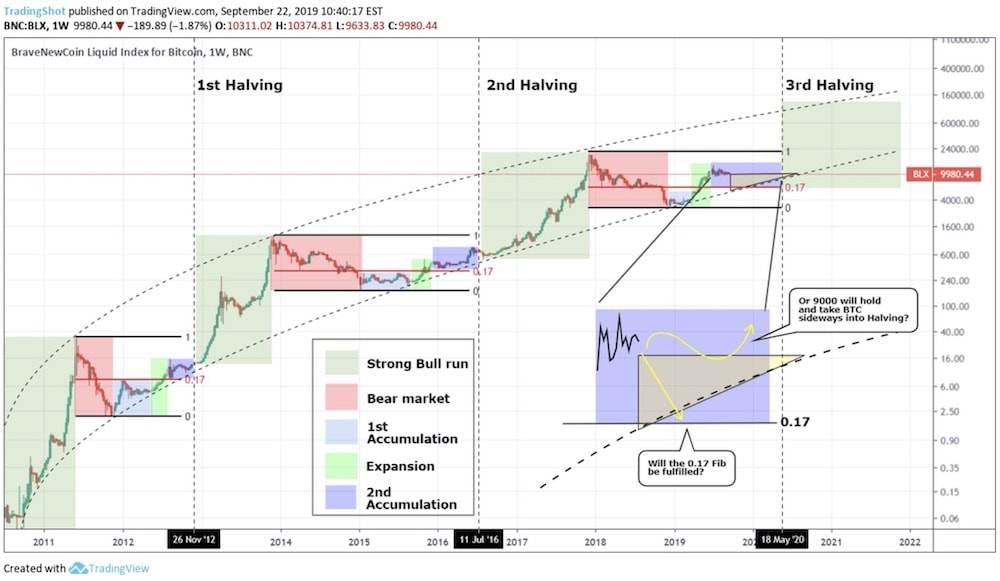
What does this all mean?
We are not as evangelistic as some of the bitcoin crowd out there, and we will not chop anything off if it doesn’t reach $500K by July of 2020.

That is actually John McAfee of McAfee Antivirus. No, we are not like that — but the ‘math’ doesn’t lie, and with the macro forces in play, we see bitcoin higher in the longer-term. Much higher.
3. Institutional moves into the space
This is pivotal to increasing market cap and broader adoption. That said, we don’t see bitcoin being used as a payment currency or through smart applications (like Ethereum)… although we did invest in RSK and got a little killed, so maybe some bias is playing out. We simply see bitcoin as a store of value; a censorship resistant, borderless, tradeable commodity that is not controlled by central banks. Institutions, family offices, prop funds, and slowly, investment funds, are starting to take on infrastructure to allow the trading and custody of bitcoin.

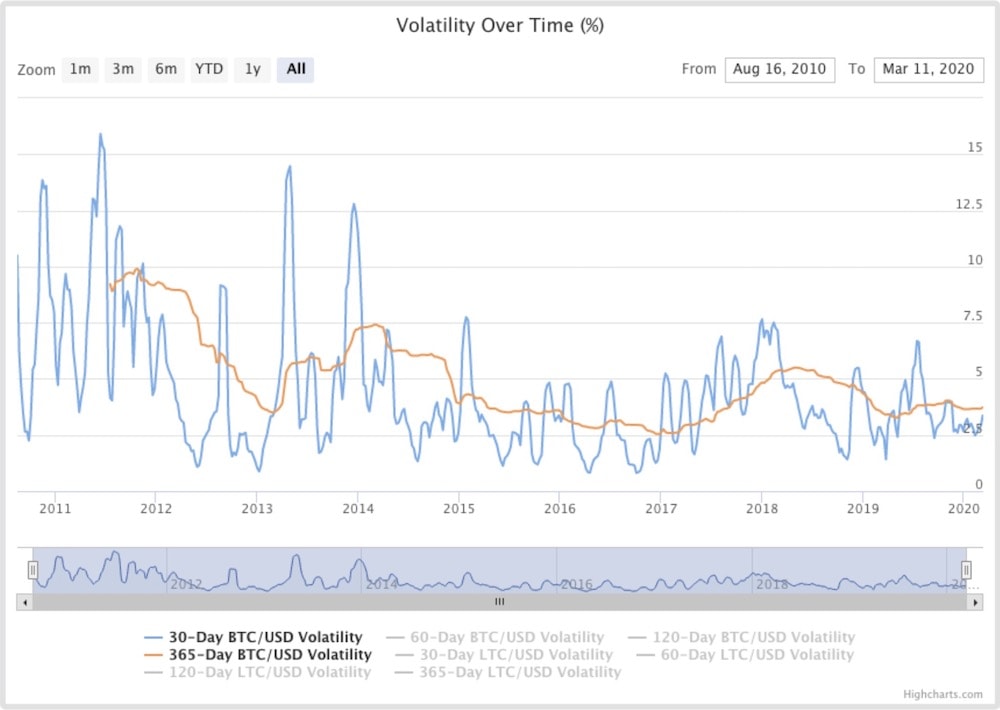
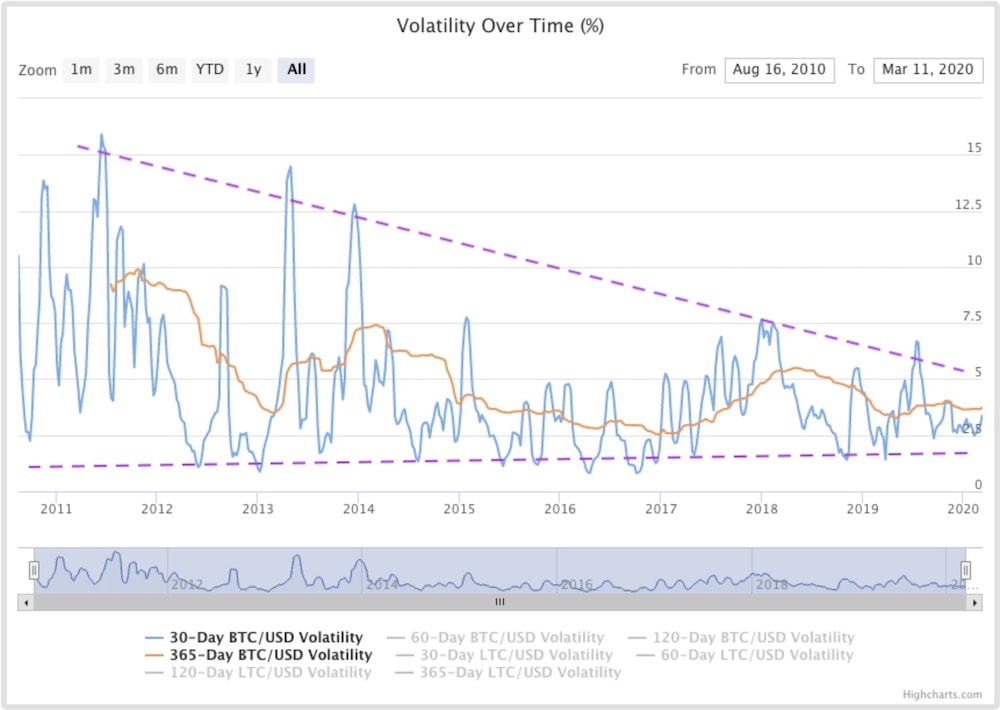
It should be noted that while institutional sponsorship in the space is a bullish case for the coin, we believe that it will reduce volatility through increased liquidity and two-way derivatives market flows (think people shorting futures on the CME). We can see that since 2010 that there has been a trending reduction in volatility:
Furthermore, a narrowing of ‘volatility of volatility’ (illustrated in purple), that will likely constrain further as more instos enter the space.
What about the ridiculous forecast?
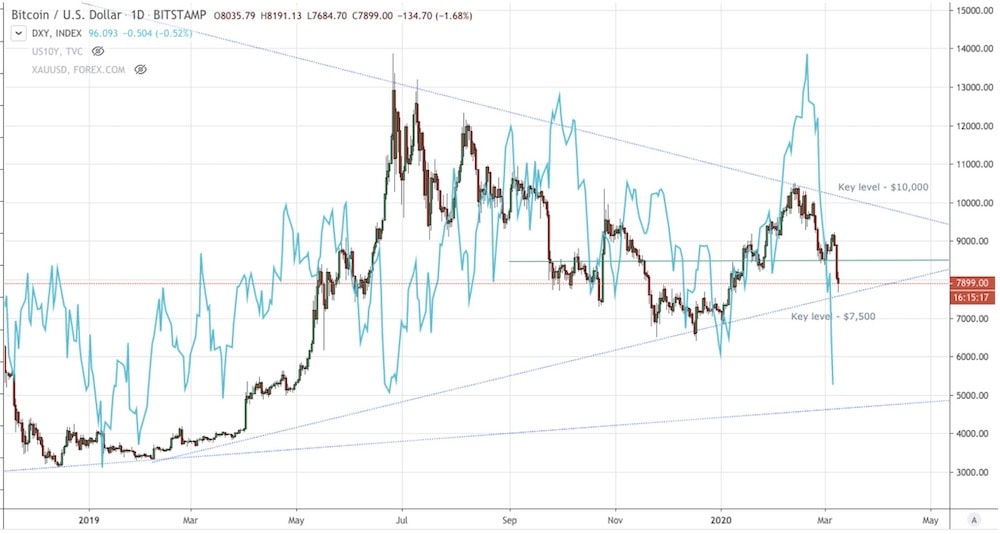
No one actually knows what’s going to happen — but if we see the $7,500 downside level broken, I think we’ll be taking out stop losses and see a move down $6,000. If $7,500 holds, a move to $9,500/$10,000, up towards the orderflow area of volume tapping the descending trendline. We are long-term buyers at $7,500 and $6,500.
Craziest thing in crypto this month
Of all the asset classes, this one has some of the wackiest stuff going down. In this monthly column we take a look at the craziest things to happen over the prior month. In this episode:
How to make $320,000 in a few seconds
Flash loans are a simple(ish) new DeFi (decentralised finance) innovation: zero-risk (in theory) loans via a smart contract, without requiring collateral. Well… This new innovation just got smashed by a couple of ingenious exploiters. How, you ask? Well, flash loans mitigate counterparty risk and illiquidity risk (the risk that the asset that I loan is used for some purpose and unable to be paid back due to fluctuations in liquidity; I am then unable to meet my obligations).
Flash loans achieve this by using smart-contracts: digital contracts that have sets of rules attached to transactions. The way they these contracts are being used in a flash loan goes a little something like this:
Imagine that I lend you $500 to invest, but it must be spent in a timely fashion. So you decide to buy a discounted painting on Amazon for $500, and then quickly sell it on eBay for $550. Boom! Netted $50, and paid me (the lender) back $510 for the trouble. Awesome.
Now imagine if it went the other way: you bought the painting on eBay for $500, but could not offload it on eBay. Or for that matter, not offload it anywhere at all. What now? Well you’re in the hole for $510 to me (accruing interest), and I need capital to lend to other people. Imagine that in this scenario, we could just reverse the Amazon purchase and reverse the initial loan? Well with smart contracts, you can.
With a flash loan, if you cannot pay back the principal and fee to the lender, the entire chain of transactions is reversed. You can do this, because all of these transactions sit on the one, or sometimes, connected blockchain ledgers (I’m pretty sure; propellor heads out there, correct me if this is way off).
So how do I turn this model into $320,000 in a few seconds? Like this:
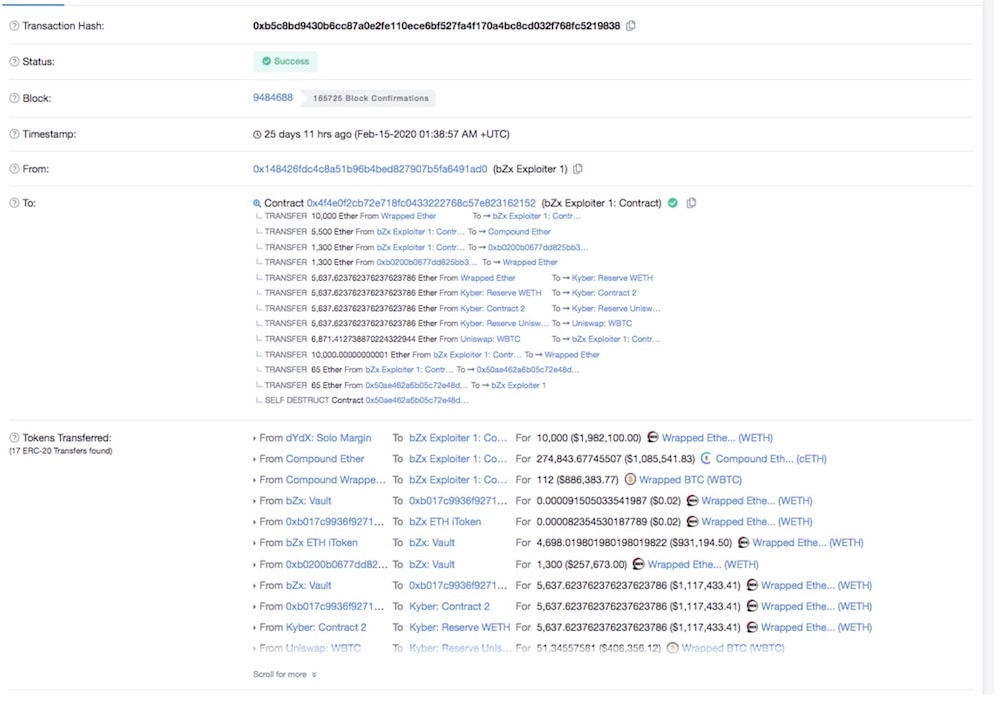
I’m told that this code essentially says that the attacker:
- Took out a 10,000 Ethereum (ETH) flash loan on dYdX worth $2.6m
- Of which, 5,500 ETH was sent to Compound Finance
- This was used as collateral to take out a loan of 112 Wrapped Bitcoin (wBTC — an illiquid, synthetic bitcoin token on the ERC20 blockchain)
- Then 1,300 ETH (from the dYdX loan) was sent to the Fulcrum platform (bZx) at 5x leverage and…
- …I’m losing myself here… but hang in there with me… On the Fulcrum platform, the attacker went short ETH and long wBTC
- Now wBTC has low liquidity… So, using KyberSwap – another Defi platform – the 5,500 ETH is then swapped (buy) for wBTC, causing a big price spike and opening the arbitrage opportunity
- The next lines of code are him (or her) closing their positions and thus the arbitrage opportunity, and repaying the original loan, netting over $320,000 profit… Taken in ETH, in a couple of seconds. Risk free. Kaboom.
Some crazy stuff. Some are calling this a perfectly legal exploit — gaming a system within it’s ruleset. I’m not sure how the SEC would view intentionally moving an illiquid market for profit though…
Anyway, that’s it from us! We wish you the best of luck for the coming month. See you in the next, where we’ll be bringing you a story of a Venezuelan Bitcoin early adopter amongst other market insights.
Update 15 March, 2020
Well holy moly – what a week. It really shows how much can shift when volatility goes through the roof. Bitcoin, along with a suite of other assets, has seen some massive moves. The Dow Jones took its biggest daily fall since 1987: almost 10%. The S&P 500 and the Nasdaq each down over 9%. Bitcoin followed with its worst drop since 2013, losing close to 50% of its value from $7,700 down $3,800.
The media are claiming Coronavirus is the primary ‘cause’, along with oil shocks from the Saudis leading to deleveraging in equities and associated risk assets. We rather view these events as the match that lit the fire on a system that has had growing systemic risks and asymmetry since the Global Financial Crisis.
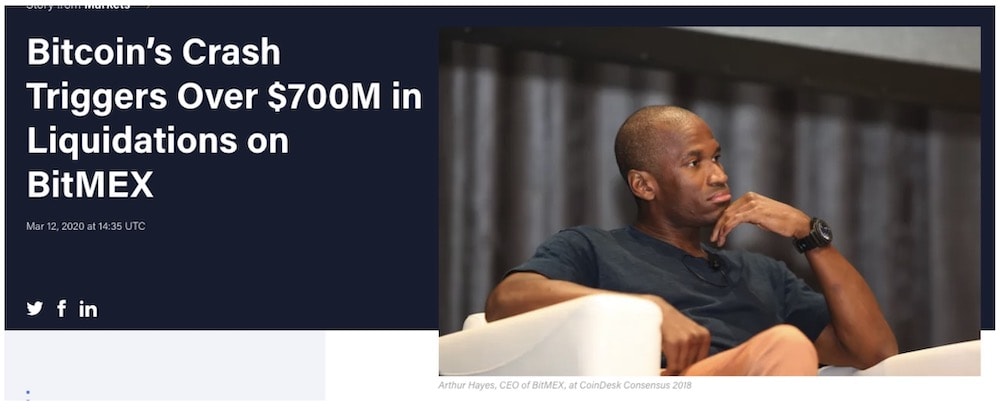
What we did not expect is the associated dump in bitcoin, that on further investigation, was primarily led by derivatives liquidations in an overly crowded long BTC trade. Data from Skew showed that BitMEX had the most liquidations of XBTUSD contracts since we started tracking the exchange in 2018: over $1bln sell orders. This led to a price discrepancy at one point of over 10% between the derivatives and spot pricing.
Let’s look at what went down:
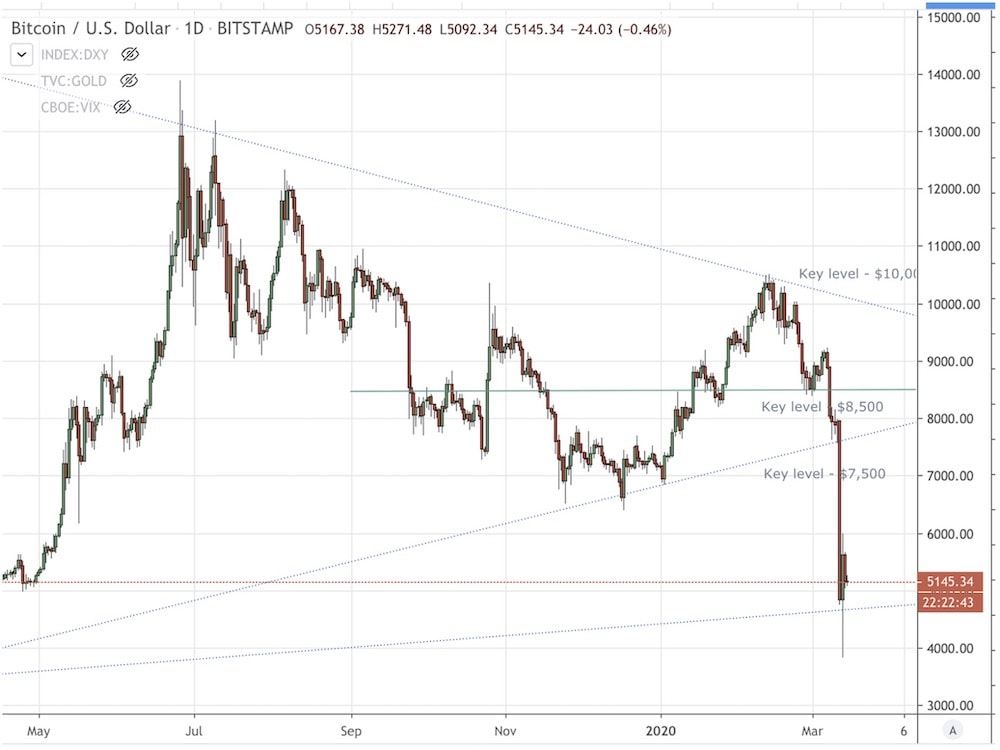
This is a daily chart.
If we zoom out to a weekly chart, price busted through a long-term ascending trendline from 2017, that would’ve led to cascading stop loss liquidations:
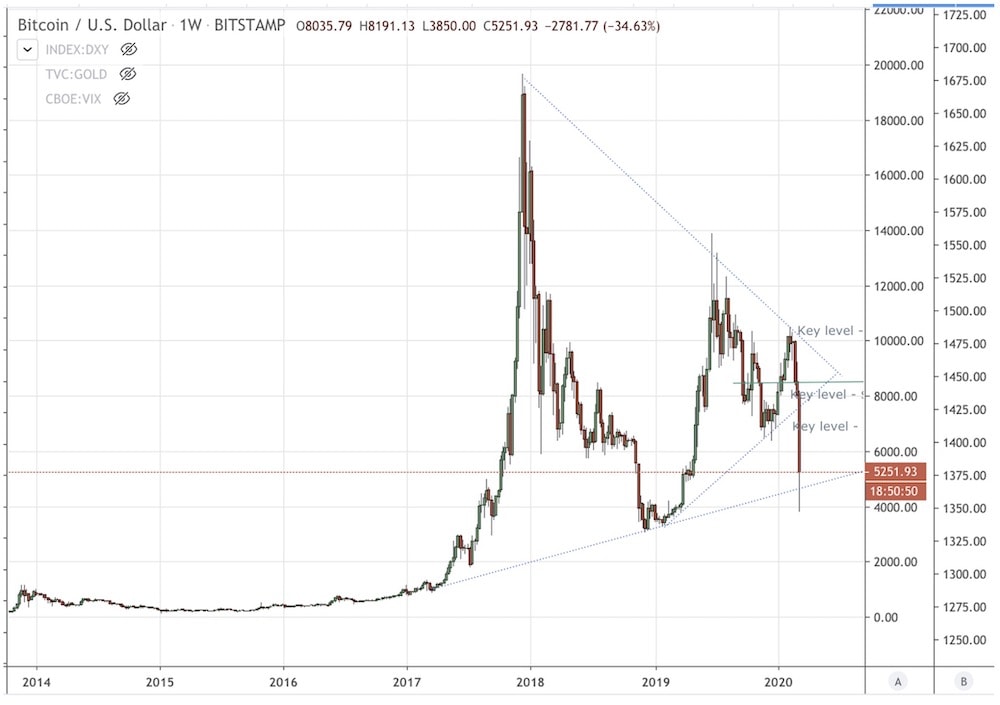
This highlights the power of derivatives markets. When we open the gates and give everyone access to insane leverage in an already volatile market, it can lead to extended spikes in the underlying markets. We know a very experienced bitcoin investor that was liquidated at $5,700 on a fairly large order – he was trading at 2:1 leverage. Can you imagine the 100:1 leveraged dudes getting smoked here? Painful.
How do recent events change our view?
We are still of the opinion that increased liquidity and institutional sponsorship will lead to less volatility, and hopefully less carnage in the future. We are still in the very early days of this crisis. We are going to see more volatility across asset classes, more intermarket re-pricing and, quite frankly, surprises that we can’t even foresee. We can, however, manage risk and trade/invest in a way that takes advantage of the (long overdue) correction in the financial system.
Our longer-term base case is that bitcoin will join the USD as a liquidity haven, that additionally protects from central bank and governmental policies that put peoples’ livelihoods at risk.
Our short-term view is a little more nuanced: the futures curve has shifted to backwardation, uncertainty is rife, and there is no clear direction in any market right now. Friday saw the virus increase in severity, and with it a stronger policy response from across the world, leading to a 5%+ rally in the S&P 500. The market mood is volatile, and tough to call short-term.
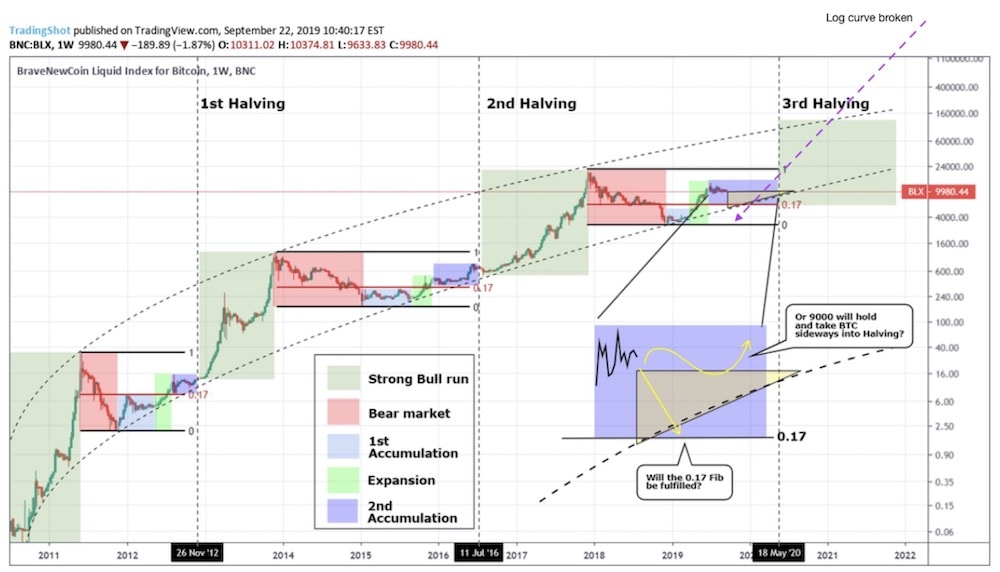
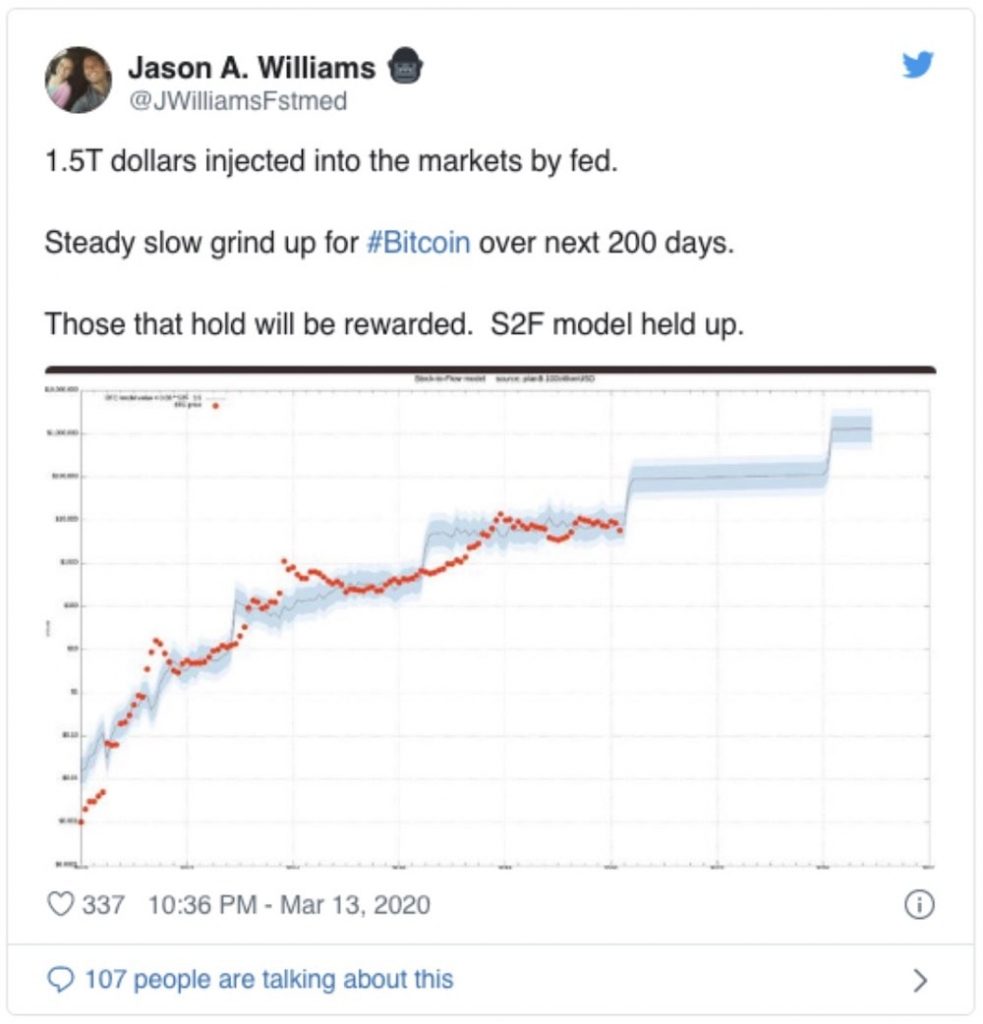
The technicals show the logarithmic BTC curve has broken down, which the speculative market will view as bearish. Though notably, the highly cited Stock-to-Flow model is still intact.
In short: a lot of uncertainty, but with this, brings great opportunity. We are still buyers down at these levels, although keeping a good chunk of capital fresh in case of more falls. Furthermore, futures arbitrage is a great way to play this kind of volatility in bitcoin, especially when the curve returns to contango. We’ll be keeping an eye on this and bringing you some insights in the coming months.
Stay safe out there!
ZeroCap provides digital asset execution and bespoke financial solutions for private clients, high net worth individuals and institutions globally. If you would like to know more hit up JD at vip@zerocap.io.


